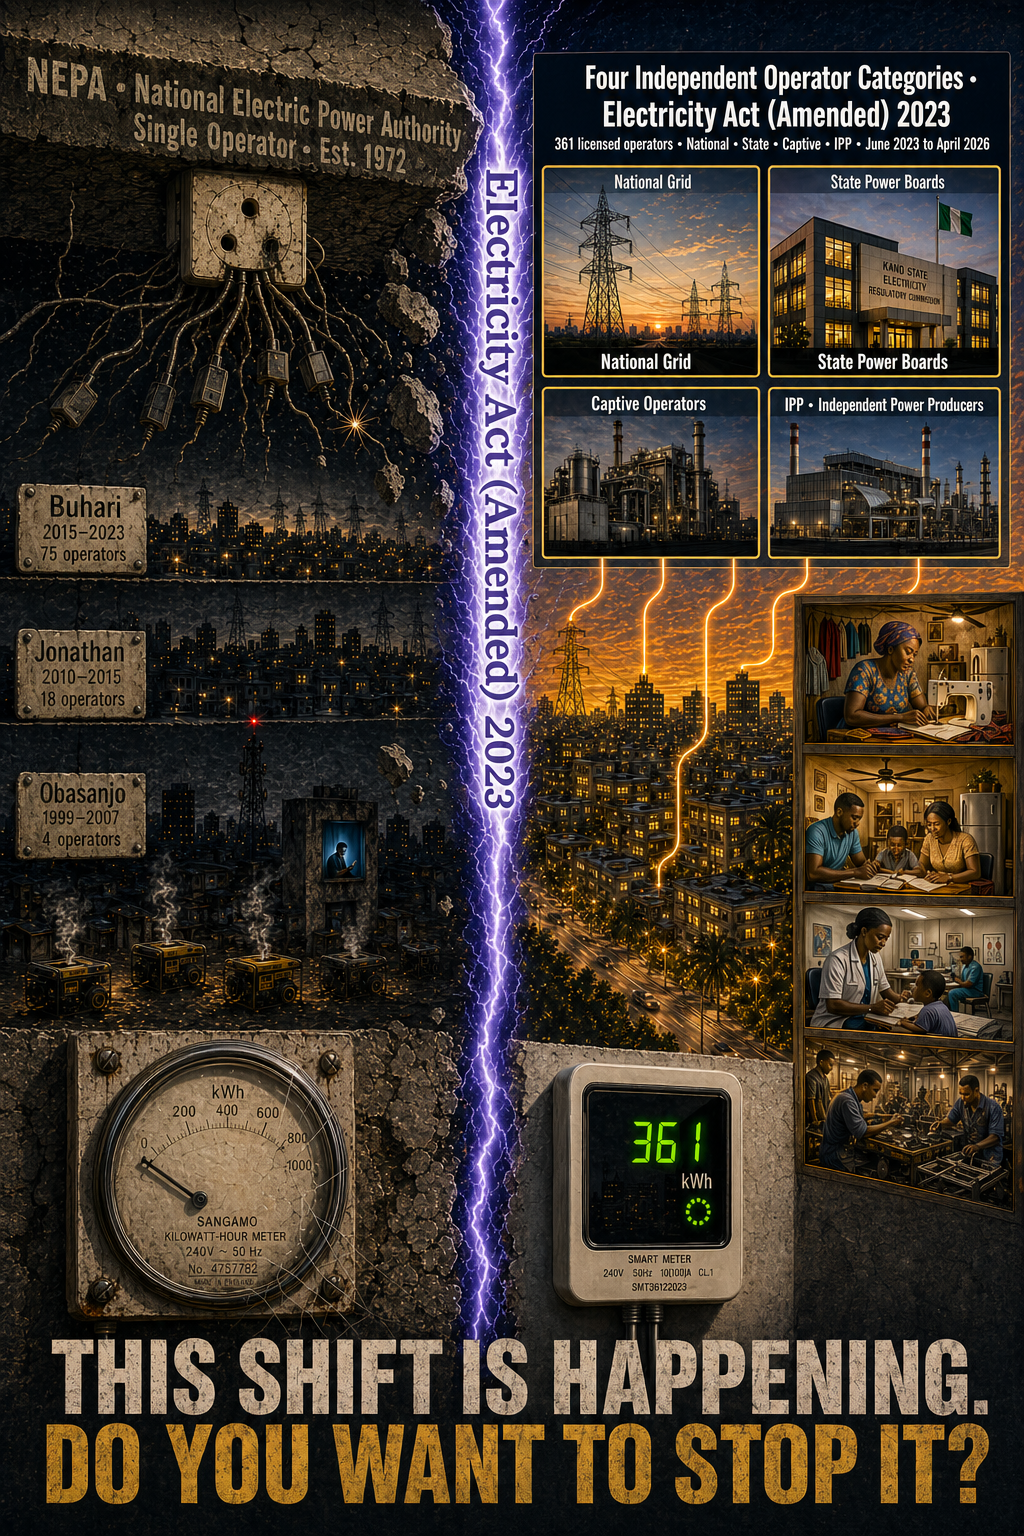
Power Sector in Nigeria was 40 years broken.
As promised, it is finally being fixed.
Are you the one who will break it again?
In under two years, President Tinubu’s Electricity Act 2023, signed on 9 June 2023 just eleven days after his inauguration, brought more new power market entrants into Nigeria than all previous administrations combined. Available grid generation has risen from 4,388 MW (megawatts) at the end of the Buhari era to a record 6,003 MW in March 2025, the highest in Nigeria’s history. Beyond the grid, 250+ newly licensed captive operators now command a further 6,500 MW, effectively doubling the nation’s total available generation. This is what structural reform looks like when it finally works.
New market entrants by administration
The chart below shows the number of new licensed power operators added to Nigeria’s electricity market under each presidential administration. Four administrations built the foundations. One broke the dam.
New licensed power market entrants per administration · all operator categories included
Includes all NERC (Nigerian Electricity Regulatory Commission)-licensed generators (grid + off-grid), distribution operators, captive permit holders and state market entities. Tinubu-era count reflects June 2023 to April 2025. Sources: NERC · Mordor Intelligence · Nairametrics.
1999–2007
2007–2010
2010–2015
2015–2023
May 2023 to now
Each administration built on the last, but none produced market entry at anything close to the pace of the Tinubu era, defined by the Electricity Act 2023 (the Electricity Act (Amended) 2023), signed by President Bola Ahmed Tinubu on 9 June 2023, eleven days after his inauguration. Obasanjo gave Nigeria the legal architecture. Yar’Adua preserved it. Jonathan executed privatisation and created the first genuine operator plurality. Buhari deepened the market with IPPs (Independent Power Producers), embedded generators and tariff reform. Tinubu then did something none of his predecessors had dared: he removed the federal ceiling entirely, empowering every state to become its own electricity market. The result is a near-vertical entry curve; over 275 new licensed operators in under two years, representing more than 75% of Nigeria’s entire licensed operator base.
The implication — more entrants, more power
Market plurality is not an end in itself. It is a means to an end: more generation capacity, more megawatts reaching Nigerian homes and businesses. The chart below makes that causal link explicit. As the number of licensed operators grew under each administration, so did total available generation. The Tinubu era’s explosion in new entrants, unleashed by the Electricity Act (Amended) 2023, has produced a corresponding leap in total generation capacity. That leap comes from both the national grid and the new captive sector that the Act unlocked.
Nigeria generation capacity (MW) · grid available · captive/off-grid · total combined · 1999–2025
Grid available capacity: NERC Market Competition Reports · Punch (Oct 2023) · TCN (Transmission Company of Nigeria)/Ministry of Power (March 2025). Mid-period grid dip reflects plant deterioration from the sector’s liquidity crisis; installed capacity never fell. Captive/off-grid: Mordor Intelligence (2026) citing NERC permit data; this category barely existed as a licensed market before June 2023.
Total combined = grid available + captive/off-grid. The two are additive: captive operators generate independently of and in addition to the national grid.
The target — what OECD power markets look like
The world’s most advanced power markets share one defining feature: plurality. The Organisation for Economic Co-operation and Development (OECD) is a group of 38 advanced economies that collectively set the benchmark for market structure and regulatory quality. The five charts below show Nigeria’s operator count at each reform milestone, measured against the same OECD benchmark every time. Watch the Nigeria bar grow.
Nigeria operator counts include all NERC-licensed generators (grid + off-grid), DisCos, captive permit holders and state market entities. OECD counts are indicative; sources: national regulators.
Nigeria’s peer group: comparable OECD economies
Focusing on OECD countries comparable to Nigeria in population and development stage, Nigeria’s current 361 licensed operators now places it firmly within its peer range.
Total operator counts — OECD peer economies vs. Nigeria today
Nigeria’s 338 generation-side operators includes 29 grid GenCos, 74 off-grid licensed generators and 235+ captive permit holders. Distribution count of 23 includes 12 legacy DisCos and 11 state market transfer orders. Sources: NERC Q1 2024 · Mordor Intelligence (2026) · Nairametrics (Feb 2025).
Section 4: how Nigeria got here — the reform timeline
The entry surge did not happen by accident. Each administration laid a specific piece of the architecture that made the Tinubu-era acceleration possible.
Section 5: market participants as liberalisation progressed
Licensed operators, institutions and mechanisms by administration
| Segment | Obasanjo 1999–2007 |
Yar’Adua 2007–10 |
Jonathan 2010–15 |
Buhari 2015–23 |
Tinubu 2023– |
|---|
Section 6: the dramatic rise — Nigeria’s operator count 1999–2026
The chart below maps Nigeria’s total licensed operator count across each reform era on a log scale. The near-vertical acceleration from May 2023 is not a projection; it is what actually happened when the federal ceiling was removed.
Nigeria total licensed power operators · log scale · administration colour bands
The remaining challenges and how they are being fixed
The direction of travel is clear. Five structural problems, all of which pre-date the current administration, continue to constrain the sector. Each has a named fix already in execution.
Chart A: where the megawatts go — the capacity waterfall
Nigeria’s 13,625 MW of installed generation capacity loses more than two-thirds of its potential before revenue is recovered. Each step down has a named cause and a named fix running in parallel.
Capacity waterfall · MW lost at each constraint · causes and fixes
Sources: NERC Q1 2025 · Mordor Intelligence · BPE. Revenue-recovered figure is estimated from 73.4% collection efficiency applied to dispatched generation.
Chart B: the chain that cannot pay itself
Money should flow upstream from customers to gas suppliers. Instead, each link retains less than it should — starving the next link and compounding the problem across the entire value chain.
Payment chain · what flows vs. what should flow · Q1 2025 data
Sources: NERC Q1 2025 · Sahara Reporters · BusinessDay · Guardian Nigeria. The N474bn annual growth in sector deficit is per French Development Agency estimate. Total government intervention under Buhari: N7 trillion.
Chart C: who owes what — and for how long
Non-payment is not a new problem. Government MDAs (Ministries, Departments and Agencies) have owed DisCos since privatisation in 2013 — 12 years of accumulation. The military’s debt was written off in 2005, then rebuilt. Residential customers account for the largest single share. In Eko DisCo alone, N96 billion owed and climbing, a debt that has accumulated since privatisation in 2013, over twelve years. People like you and I, citizens; this is their contribution to the problem. All of this precedes the Tinubu administration.
Electricity debt by category · N billion · as of November 2025 (Eko DisCo detailed; national MDA estimate)
Chart D: fixes in progress — where each intervention stands
Every challenge above has an active intervention. These are not policy announcements, they are funded, contracted and measurable. The AKK pipeline alone will unlock gas supply to northern plants that have idled for decades.
Reform interventions · percentage complete or deployed · April 2026
Sources: NERC Q1 2025 · NUPRC (Nigerian Upstream Petroleum Regulatory Commission) · Channels TV (March 2026) · Ministry of Power · BPE · Mordor Intelligence.
This is the right direction
Every number in this article points the same way. New market entrants: from 3 under Obasanjo to 275+ under Tinubu in under two years. Grid generation recovering to a record 6,003 MW. Total capacity including captive operators: 12,503 MW, more than eight times what Obasanjo inherited in 1999. The OECD peer benchmark, once an aspiration, is now within reach.
Nigeria has done in two years what took most OECD countries a decade: moved from a federal monopoly to a federated, competitive, multi-layered electricity market, through legislation, through regulatory architecture, through state empowerment, and through the removal of barriers that had kept private capital on the sidelines for a generation.
Each new state regulator is a new market. Each new captive permit is a new megawatt outside the grid. Each bilateral contract is a price signal that did not exist before June 2023. The OECD benchmark is not a ceiling; it is the floor of what Nigeria’s own legislative architecture now makes possible. The sector was 40 years broken. The data demonstrates how it is finally being fixed. The only question now is will we allow it to be fixed permanently, in a way that delivers the power that has started coming and can never be reversed?
Leave a Reply